
Microbee Support Team
Reading Time :
8 Minute
Virtual sports represent one of the fastest-growing segments in online betting, delivering 24/7 revenue streams that don't depend on live sporting schedules. With the global virtual sports betting market projected to reach $38.45 billion by 2031 (growing at 17.3% CAGR), operators who haven't integrated virtual sports are leaving significant revenue on the table.
This comprehensive comparison examines leading virtual sports betting platform providers—Betradar, NSoft, Kiron, and MicroBee—analyzing graphics quality, sports variety, betting markets, integration complexity, and revenue potential. Whether you're adding virtual sports to existing operations or launching new platforms, this guide provides the decision-making framework for maximizing this explosive growth opportunity.
Why Virtual Sports Are Essential: 24/7 Betting and Off-Season Revenue
Traditional sports betting faces an inherent limitation: dependency on live sporting events. Virtual sports eliminate this constraint entirely, creating constant betting opportunities that drive player engagement and revenue regardless of real-world sporting calendars.
Continuous Revenue Generation
Virtual sports operate 24 hours daily, 365 days yearly. Events run every 2-5 minutes, creating dozens of betting opportunities hourly. This continuous operation generates revenue during: overnight hours when live sports aren't available, off-seasons for popular sports (NFL, NBA, European football), gaps between major sporting events, and periods of low real-sports betting activity.
Operators report virtual sports contributing 15-30% of total sportsbook revenue, with peak contribution during off-season periods when traditional betting volume declines. This revenue diversification reduces dependence on major sporting events and creates predictable baseline income.
Player Retention During Quiet Periods
Sports bettors don't stop wanting to bet just because live games aren't happening. Virtual sports keep players engaged during: early morning hours (2AM-7AM), summer months when major sports leagues pause, international breaks in football leagues, and midweek periods with limited live action.
Without virtual sports, players migrate to competitors offering 24/7 betting options. Operators with comprehensive virtual sports portfolios retain 35-40% more players during off-peak periods compared to sports-only platforms.
Lower Operational Risk
Virtual sports eliminate many risks associated with live sports betting: no match-fixing concerns (outcomes determined by certified RNG), no weather cancellations or postponements, no player injuries affecting outcomes, predictable margins (typically 8-12%), and no exposure to unexpected results from obscure matches.
Risk management becomes dramatically simpler—virtual sports operate within predetermined parameters, eliminating the liability spikes common in live betting. Operators maintain consistent profitability without the volatility inherent to real sports outcomes.
Market Size and Growth Projections
Understanding market trajectory helps operators gauge investment priorities. Virtual sports have evolved from niche offering to essential platform component, with explosive growth continuing through 2031.
Current Market Size
Global virtual sports betting market size: $9.23 billion (2022), $12.68 billion (2024), projected $38.45 billion (2031). Compound Annual Growth Rate (CAGR): 17.3% (2024-2031). Regional breakdown: Europe 45% (UK, Italy, Spain leading), Asia-Pacific 28% (fastest growth region), North America 18% (US state legalization driving expansion), Latin America 6%, and Middle East/Africa 3%.
This growth outpaces traditional sports betting growth (12.18% CAGR), reflecting virtual sports' ability to capture betting volume during periods when live sports can't.
Growth Drivers
Several factors accelerate virtual sports adoption: Technological advancement: HD graphics, realistic animations, and physics engines approaching photo-realism. Mobile optimization: 70%+ of virtual sports bets placed via mobile devices. Regulatory acceptance: Major jurisdictions treating virtual sports as standard betting product. Player familiarity: Growing acceptance of simulated sports through esports and gaming. Improved RNG technology: Enhanced realism and unpredictability maintaining player trust.
The convergence of these factors creates favorable conditions for sustained market expansion through 2031 and beyond.
Revenue Contribution by Operator Type
Virtual sports revenue contribution varies by operator profile: Established operators (5+ years): 15-20% of total betting revenue. New operators (<3 years): 25-35% of total revenue (higher due to limited live sports coverage). Retail operators: 30-40% of shop revenue (constant availability critical for retail). Mobile-first operators: 20-30% of revenue (perfect fit for on-the-go betting).
These percentages represent sustainable, recurring revenue that doesn't require major sporting events or expensive sponsorship deals to generate.
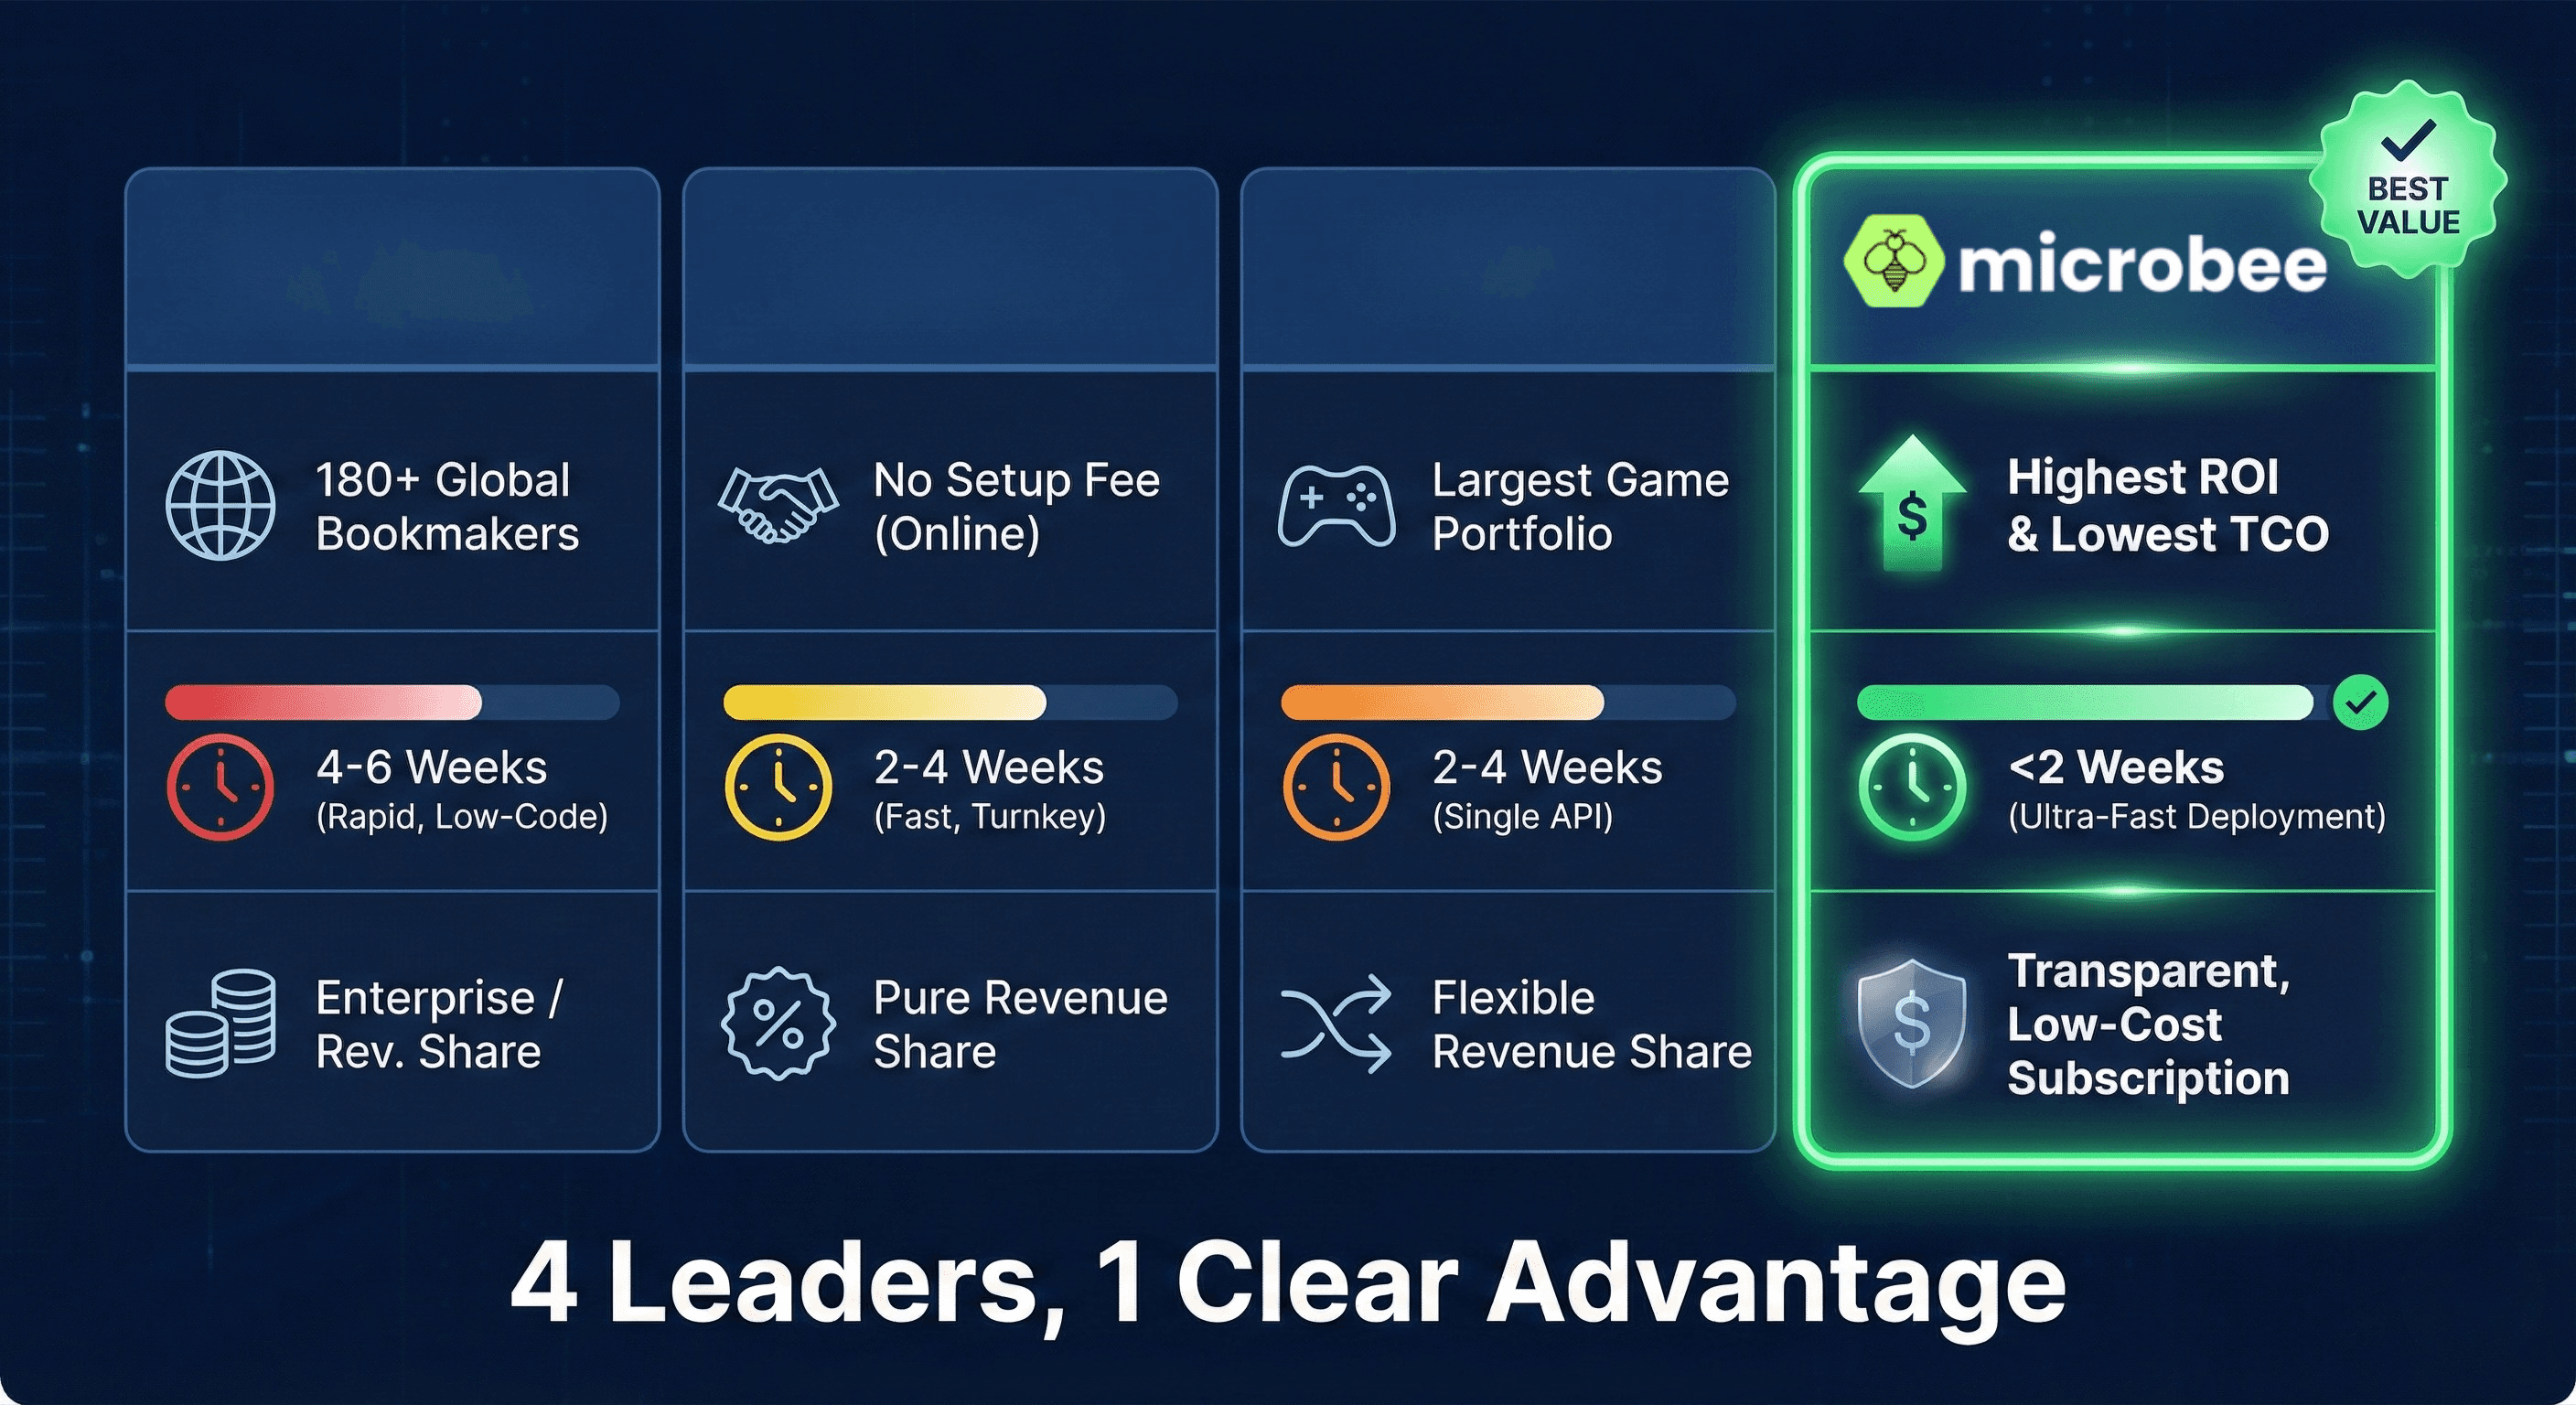
Provider Comparison: Betradar, NSoft, Kiron vs MicroBee
Four major providers dominate the virtual sports market, each with distinct strengths, pricing models, and integration approaches. Understanding these differences is critical for selecting the optimal solution.
Feature | C 1 | C 2 | C 3 | MicroBee |
Market Position | 900+ operators, 120 countries | Award-winning 3D graphics | 20+ years, largest portfolio | Unified platform |
Sports Variety | Football, racing, tennis, basketball | Racing, football, virtual games | 20+ sports, number games | 15+ sports |
Integration Time | 4-6 weeks | 3-5 weeks | 3-4 weeks | 1-2 weeks |
Pricing Model | Revenue share 8-12% | Revenue share 10-15% | Revenue share 8-12% | Fixed + low GGR |
Best For | Enterprise operators | Retail + online | Wide variety needs | All operators |
Graphics Quality and Realism Comparison
Visual quality directly impacts player engagement and retention. As virtual sports have matured, graphics technology has reached near-photorealistic levels, with significant differences between providers.
Award-Winning 3D Graphics
Microbee has won multiple industry awards for graphics quality, featuring: Full 3D environments with realistic lighting and shadows, detailed player animations including celebrations and reactions, dynamic camera angles mimicking TV broadcasts, weather effects (rain, snow) affecting gameplay visuals, and stadium atmosphere with crowd animations and noise.
NSoft's graphics engine prioritizes spectacle—virtual matches feel like watching TV broadcasts, complete with replays, commentary, and presentation polish. This premium visual experience commands player attention and drives longer session times.
Betradar: High-Quality Realistic Rendering
As part of Sportradar, Betradar leverages extensive sports data to create: Data-driven animations reflecting real player statistics, realistic physics engines for ball movement and player interactions, authentic stadium environments modeled on real venues, broadcast-quality presentation with professional commentary, and seamless mobile optimization maintaining quality across devices.
Betradar's strength lies in authenticity—virtual matches mirror real sports closely enough that casual observers might mistake them for actual broadcasts (in thumbnail or quick view). This realism builds player trust in outcome fairness.
Kiron: Full HD GLI-Certified Quality
With 20+ years' experience, Kiron delivers: Full HD resolution across all sports, smooth 60fps animation maintaining fluidity, consistent visual quality across extensive portfolio, award-winning animation studio production, and GLI certification ensuring RNG fairness alongside visual quality.
Kiron's portfolio breadth means some sports receive more visual investment than others, but baseline quality remains high throughout. Their longevity has enabled iterative improvements raising standards across all titles.
MicroBee: HD Quality with Rapid Integration
MicroBee partners with leading virtual sports providers to deliver: HD quality graphics across core sports portfolio, mobile-optimized rendering for smooth performance, rapid deployment without quality compromise, unified platform integration simplifying operations, and consistent visual standards across all integrated content.
MicroBee's strength isn't proprietary graphics technology but rather strategic partnerships delivering high-quality content through seamless integration, enabling operators to offer premium virtual sports without managing multiple vendor relationships.
Sports Variety: Football, Horse Racing, Basketball, Tennis, Greyhounds
Content variety determines addressable player base. Different player segments prefer different virtual sports, making comprehensive portfolios essential for maximizing revenue potential.
Core Virtual Sports Categories
Virtual Football: Most popular globally (45-55% of virtual sports bets). Features league formats, cup competitions, and quick-play matches. Events every 2-3 minutes. Extensive betting markets (match result, goals, corners, cards).
Horse Racing: Second most popular (20-30% of volume). Authentic track environments and jockey colors. Events every 3-5 minutes. Win, place, exacta, and accumulator betting.
Greyhound Racing: Popular in UK, Ireland, Australia (15-20% of volume). Fast-paced with events every 2-3 minutes. Similar betting markets to horse racing.
Basketball: Growing popularity, especially in US markets (5-10% of volume). Quick matches (5-7 minutes). Point spreads, totals, and moneyline betting.
Tennis: Appeals to sophisticated bettors (5-10% of volume). Set-based matches with varied duration. Game, set, and match betting markets.
Provider Portfolio Comparison
Kiron: Largest portfolio with 20+ sports including niche options (badminton, table tennis, skating). Comprehensive racing category (horses, greyhounds, motorcycles, cars). Number games and lottery-style products.
Betradar: Focus on major sports with deep market coverage. Football, basketball, tennis, horse racing. Emphasis on realistic simulation of popular sports.
NSoft: Strong racing focus (multiple formats). Virtual football and basketball. Innovative virtual games category. Omnichannel optimization (retail and online).
MicroBee: 15+ core sports covering major categories. Strategic partnerships enabling portfolio expansion. Unified platform simplifying multi-provider management. Focus on high-revenue sports with proven player demand.
Betting Markets and Odds Flexibility
Market depth and odds customization determine revenue optimization capability. Operators need flexibility adjusting margins and markets based on player preferences and competitive positioning.
Standard Market Coverage
All major providers offer: Primary markets (match result, win/place, totals), combination bets (accumulators, system bets), in-play betting during event simulation, and multiple odds formats (decimal, fractional, American).
The baseline is similar across providers—differentiation comes from market depth within each sport and operator control over odds settings.
Odds Configuration Control
Operators require different levels of control: Fixed margins: Provider sets odds with predetermined margin (8-12%). Pros: Simple, no trading expertise required. Cons: Less competitive pricing, margin inflexibility.
Operator-controlled margins: Operators adjust margins per sport/market. Pros: Competitive pricing, promotional flexibility. Cons: Requires trading knowledge, more complex operations.
MicroBee advantage: Flexible margin configuration with trading support. Operators choose between preset margins or custom control. Technical support available for optimization. Default settings proven across 300+ operators globally.
Market Variety by Sport
Virtual Football: 15-25 markets per match (result, goals, corners, cards, halftime/fulltime). Combo markets (both teams to score, correct score). Accumulator potential across multiple matches.
Racing (Horses/Greyhounds): Win, place, show. Exacta, trifecta, superfecta. Accumulator racing (multiple events combined).
Basketball: Moneyline, point spread, totals. Quarter/half betting. Player performance markets (some providers).
Tennis: Match winner, set betting, total games. Handicap markets. Tournament winners (where applicable).
Market variety directly correlates with average bet frequency—more markets create more betting opportunities, driving higher revenue per player.
Integration Process and Timeline
Integration complexity varies dramatically between providers and platforms. Understanding realistic timelines prevents budget overruns and missed launch deadlines.
Standard Integration Timeline
Week 1: Contract execution and credential provisioning. API documentation review. Development environment setup. Initial authentication testing.
Weeks 2-3: API integration development. Wallet system connection. Event streaming implementation. Bet placement and settlement logic. User interface integration.
Week 4: Comprehensive testing (functional, load, UAT). Bug fixes and optimization. Compliance verification. Staff training.
Week 5+: Production deployment. Performance monitoring. Optimization based on early data.
MicroBee Accelerated Timeline: 1-2 Weeks
MicroBee's unified platform architecture enables dramatically faster deployment: Days 1-3: Immediate API access with existing credentials. Pre-built integration modules for virtual sports. Automated wallet synchronization. Minimal custom development required.
Days 4-7: Front-end integration using provided components. Branding customization. Testing across standard use cases. Production deployment if testing passes.
Days 8-14: Optional custom features or market-specific adaptations. Performance optimization. Staff training and support transition.
This 50-70% timeline reduction results from: Pre-integrated virtual sports in unified platform. Standardized APIs reducing custom development. Proven integration patterns eliminating trial-and-error. Comprehensive documentation and support. Automated testing tools catching issues early.
Integration Complexity Factors
Timeline varies based on: Existing platform architecture (modern APIs faster than legacy systems), wallet system complexity (real-time balance updates critical), mobile application requirements (native apps add development time), customization level (standard implementations much faster), technical team experience (experienced developers integrate faster).
Operators with existing MicroBee sportsbook platforms achieve fastest integration—virtual sports activate as platform module rather than separate integration project.
Revenue Potential: 30% Revenue Increase Case Study
Real-world results matter more than projections. This case study demonstrates measurable revenue impact from virtual sports integration.
Operator Profile: European Sports Betting Platform
Established operator: 3 years in market with 45,000 active players. Primary focus: Football betting (65% of revenue), secondary: Basketball and tennis (25%), others: 10%. Seasonal revenue volatility: Summer months showed 40% revenue decline, off-season periods struggled to maintain player engagement.
Pre-Integration Challenges
Player churn during off-season periods, overnight hours generated minimal revenue (2AM-7AM dead zone), summer football break created 6-week revenue drought, players migrating to competitors offering 24/7 betting, and customer acquisition costs rising due to limited offering.
MicroBee Virtual Sports Solution
Integration timeline: 12 days from contract to launch. Virtual sports deployed: Football, horse racing, greyhounds, basketball. Integration complexity: Minimal (existing MicroBee sportsbook platform). Marketing approach: Soft launch, no major promotion initially.
Results: First 90 Days Post-Integration
Virtual sports adoption: 28,400 players placed virtual bets (63% of active base). Virtual sports revenue: €387,000 (22% of total revenue). Off-season performance: Summer month revenue +41% vs previous year. Overnight revenue: 2AM-7AM revenue +340% (virtual sports 85% of overnight volume). Player retention: Churn rate decreased 31% (players engaged during quiet periods).
Total revenue impact: +30% increase in overall platform revenue. Customer acquisition cost: Decreased 18% (better retention reducing new player requirements). Average player lifetime value: Increased 27% (longer engagement periods).
Key Success Factors
Rapid integration: 12-day timeline prevented extended opportunity loss. Unified platform: Single login/wallet simplified player experience. Strategic sports selection: Football and racing matched core audience preferences. Zero friction: Existing players accessed virtual sports immediately. Organic discovery: Players found virtual sports during quiet betting periods naturally.
The operator's CEO stated: "Virtual sports solved our off-season revenue problem completely. MicroBee's integration speed meant we captured summer revenue instead of watching players disappear to competitors. The 30% revenue increase exceeded our most optimistic projections."
Pricing Models Explained
Understanding pricing structures enables accurate cost projections and profitability modeling. Virtual sports providers utilize different commercial models with varying financial implications.
Revenue Share Model (Industry Standard)
Most providers charge percentage of virtual sports GGR: Typical range: 8-15% of virtual sports GGR. Calculation: Provider receives percentage after player payouts. No upfront costs: Zero initial investment barrier. Scales with success: Costs align with revenue generation.
Example calculation: €100,000 monthly virtual sports GGR, 10% revenue share = €10,000 monthly provider cost. Effective cost percentage increases with volume—higher revenue means proportionally higher provider payments indefinitely.
Fixed Fee + Low Revenue Share (MicroBee Model)
MicroBee offers hybrid pricing optimizing operator profitability: Fixed monthly platform fee: Predictable base cost regardless of volume. Low GGR percentage: 3-5% of virtual sports GGR (significantly below standard). Total cost advantage: 40-60% lower at scale compared to standard revenue share.
Example calculation: Same €100,000 monthly virtual sports GGR. MicroBee: €X fixed fee + 4% GGR (€4,000) = €X+4,000 total. Standard provider: 10% GGR (€10,000) = €10,000 total. Savings scale with growth—higher revenue creates proportionally larger cost advantage.
Setup Fees and Integration Costs
Additional costs vary by provider: Setup fees: €5,000-25,000 (one-time), depending on provider and customization. Integration development: €10,000-50,000 (internal costs or agency), based on complexity and timeline. Ongoing maintenance: Usually included in revenue share/platform fees. Marketing materials: Often provided by provider at no additional cost.
MicroBee's unified platform approach minimizes integration costs—existing sportsbook operators often activate virtual sports with minimal additional development investment.
Total Cost of Ownership (TCO) Analysis
12-month cost comparison assuming €1.2M annual virtual sports GGR:
Standard Provider (10% revenue share): Setup: €15,000. Annual revenue share: €120,000. Total Year 1: €135,000.
MicroBee (fixed + 4% model): Setup: Minimal (existing platform). Annual platform allocation: €X. Annual revenue share: €48,000. Total Year 1: €X+48,000. Savings: €72,000+ annually (53%+ reduction).
Over 3 years, cost advantages compound dramatically—operators save €150K-300K+ with MicroBee's pricing structure versus standard revenue share models.
Conclusion: Virtual Sports as Essential Revenue Driver
Virtual sports have evolved from novelty offering to essential platform component, delivering 24/7 revenue streams that complement traditional sports betting perfectly. With the market projected to reach $38.45 billion by 2031 (17.3% CAGR), operators without comprehensive virtual sports offerings face competitive disadvantage and revenue opportunity loss.
Leading providers—Betradar, NSoft, and Kiron—offer excellent products with proven track records. However, MicroBee's unified platform approach delivers unique advantages: 1-2 week integration timeline (50-70% faster than competitors), fixed-fee + low GGR pricing (40-60% cost reduction at scale), seamless sportsbook integration (no separate vendor management), comprehensive support (technical, trading, and business consultation), and proven results (30%+ revenue increases documented).
Whether adding virtual sports to existing operations or launching new platforms, MicroBee provides the fastest, most cost-effective path to capitalizing on explosive virtual sports growth. Our virtual sports betting platform integration delivers premium content, rapid deployment, and superior economics—enabling operators to focus on growth rather than technical complexity.
Ready to activate 24/7 revenue streams? Contact MicroBee today to discuss virtual sports integration, receive customized pricing proposals, and begin your accelerated deployment journey. Our gaming platform experts are ready to help you capture this high-growth opportunity.
Explore MicroBee's Virtual Sports Solutions
• Virtual Sports Platform: https://www.microbee.net/virtual-sports
• Unified Gaming Platform: https://www.microbee.net/services
• Sportsbook Integration: https://www.microbee.net/