
Microbee Support Team
Reading Time :
10 Minute
Understanding the true cost of launching and operating a sports betting platform remains one of the most challenging aspects of entering the industry. Vendors quote seemingly attractive numbers that balloon significantly once all components are accounted for. Operators who fail to anticipate these costs face budget shortfalls, delayed launches, and compromised operational capability.
This comprehensive guide breaks down every cost category operators must consider—from obvious platform licensing fees to the hidden expenses that surprise even experienced industry participants. Armed with this knowledge, operators can budget accurately, negotiate effectively, and avoid the financial pitfalls that derail promising operations.
The Total Cost of Ownership Framework
Before examining individual cost categories, understanding the Total Cost of Ownership (TCO) framework prevents the common mistake of focusing solely on headline licensing fees. TCO encompasses all expenses from initial launch through ongoing operations, providing the comprehensive view necessary for accurate financial planning.
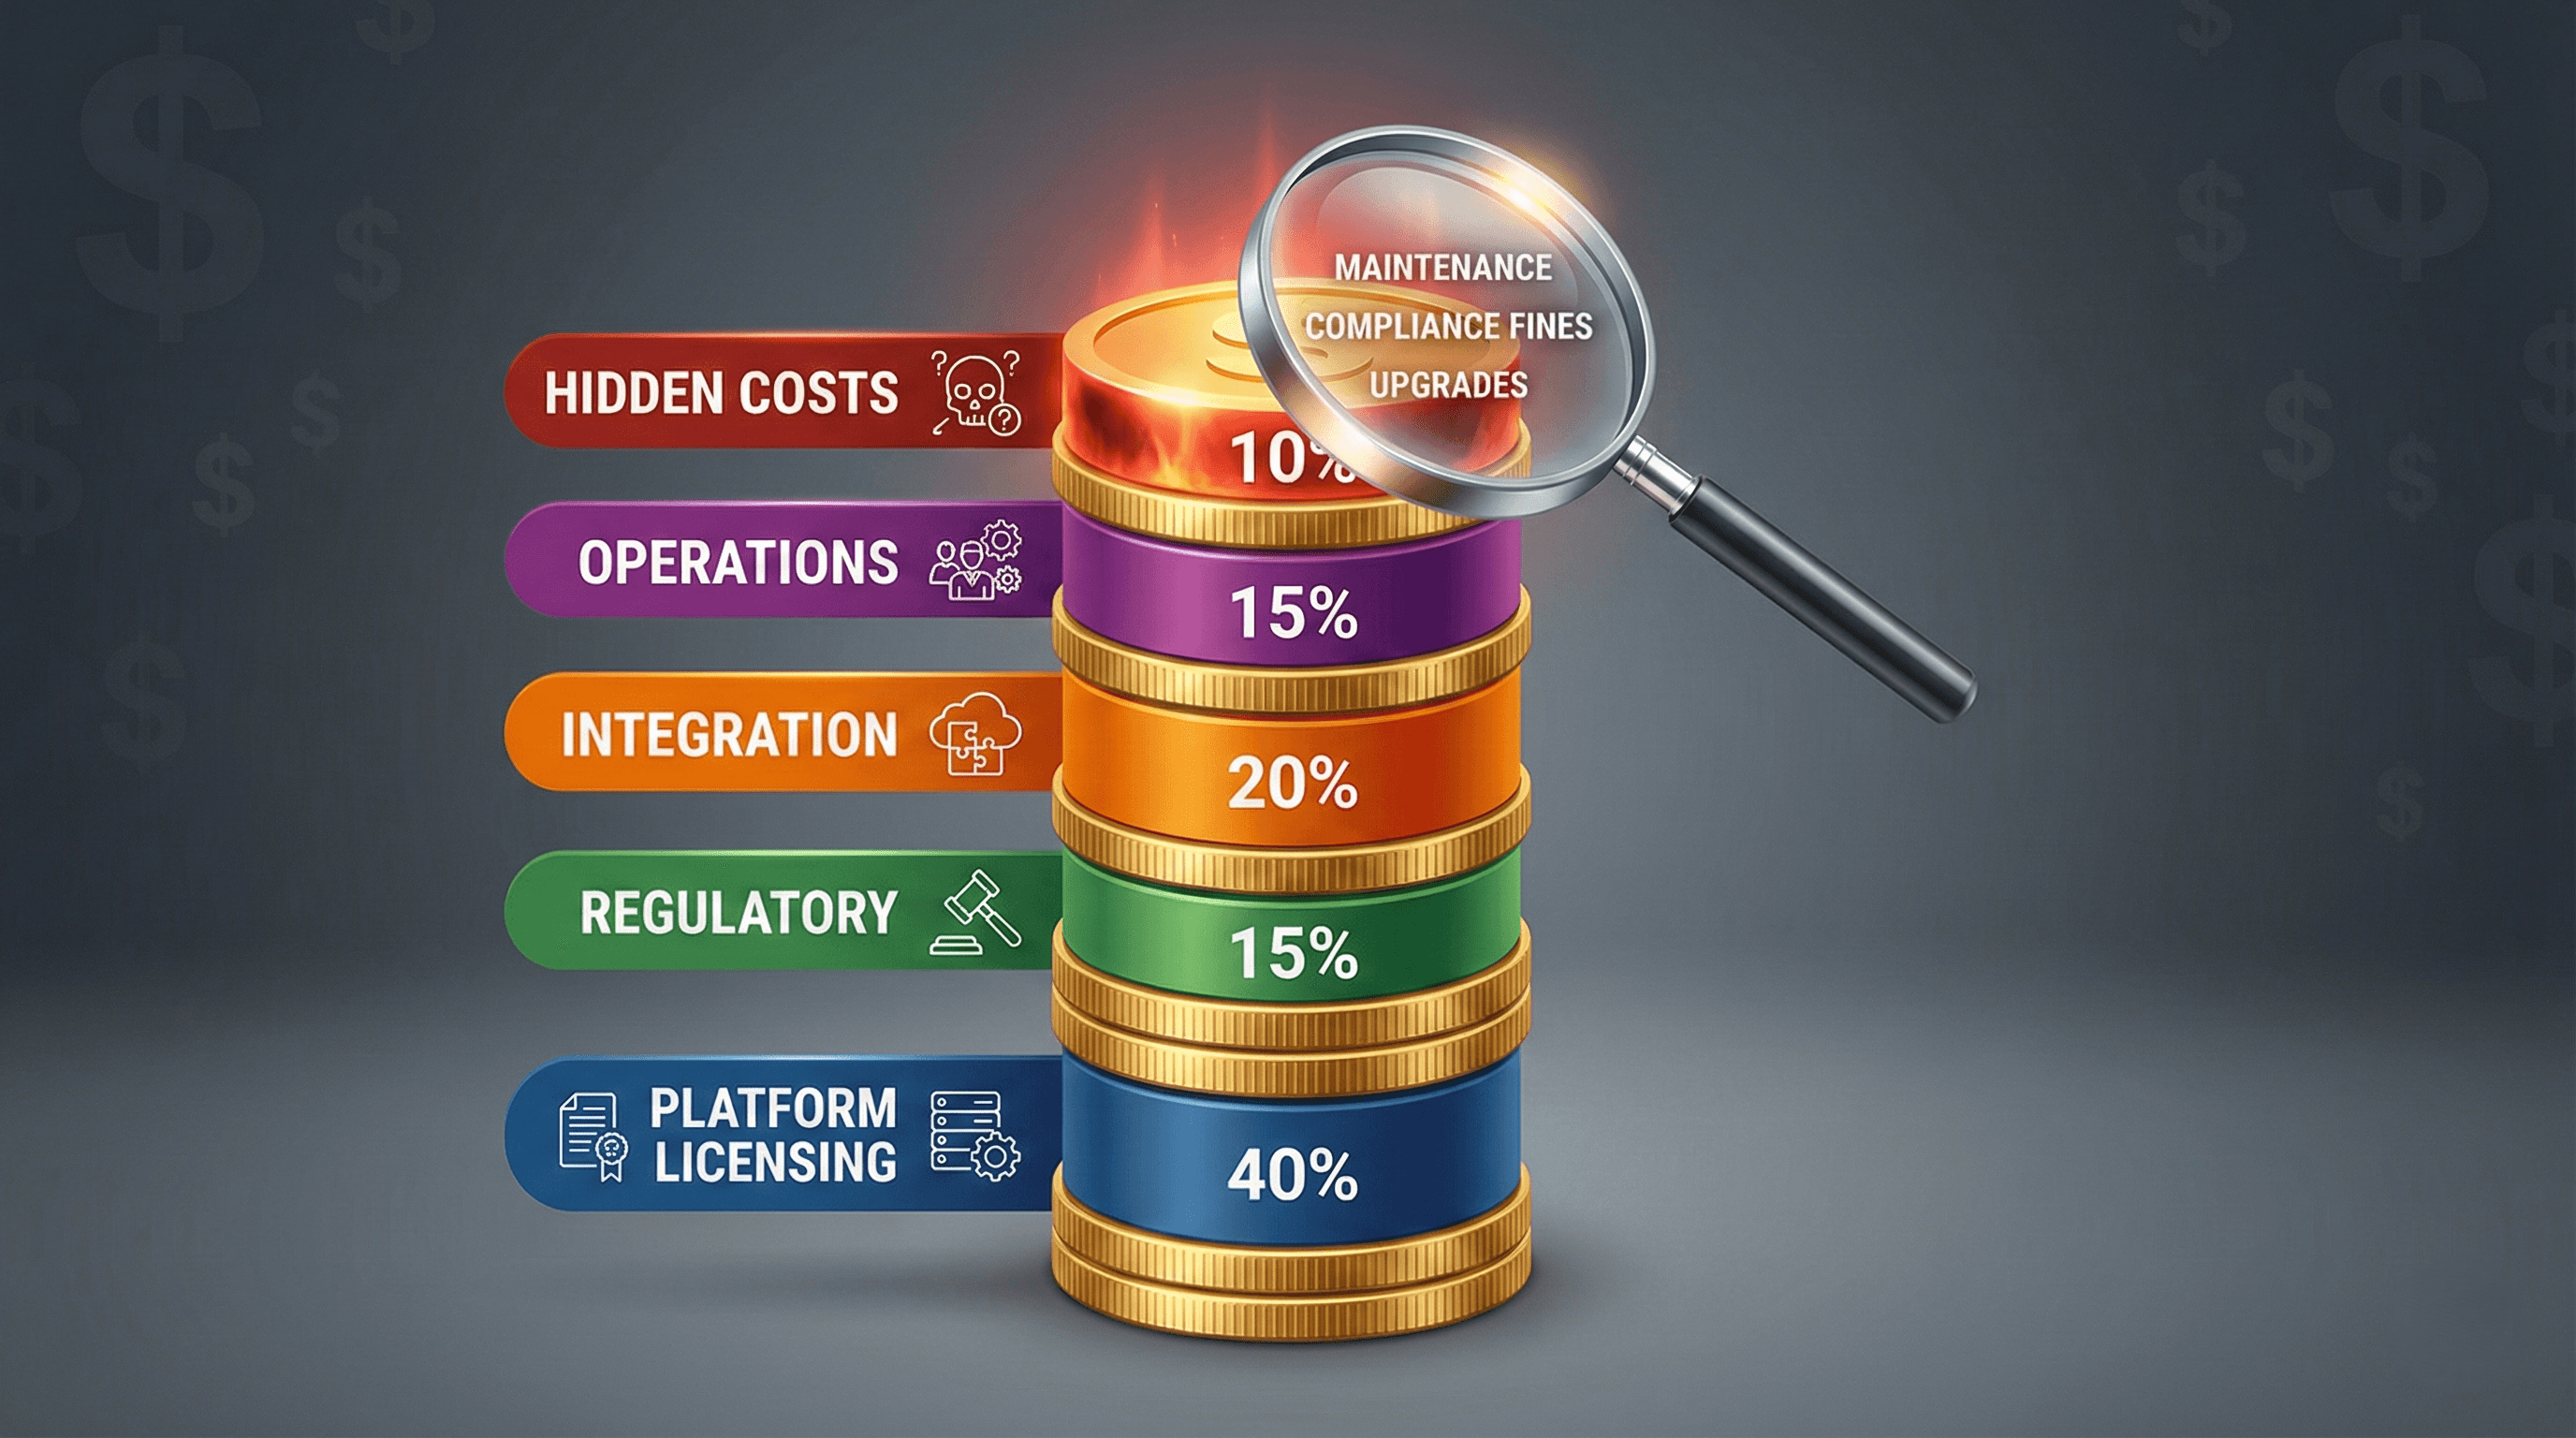
Sports betting platform costs divide into four primary categories: initial setup costs, recurring operational costs, variable costs tied to business volume, and hidden costs that emerge over time. Each category demands careful analysis to prevent budget surprises.
Initial Setup Costs
Launch costs represent the capital required before accepting the first bet. While some operators underestimate these expenses hoping to economize, inadequate initial investment often results in subpar launches requiring expensive remediation.
Platform Licensing and Setup Fees
Platform providers charge various combinations of setup fees and ongoing licensing. Understanding these structures enables meaningful cost comparisons. When evaluating the best sportsbook software providers, operators must look beyond headline numbers to understand complete fee structures.
Turnkey Platform Setup: $25,000 - $100,000. Lower-cost providers like MicroBee offer rapid deployment with minimal setup fees, while premium providers command significant upfront investment. Setup fees typically cover initial configuration, branding customization, and basic training.
White-Label Solutions: $50,000 - $250,000. Greater customization capability increases setup complexity and cost. Extended development timelines for custom features further increase investment.
Enterprise/Custom Platforms: $500,000 - $2,000,000+. Fully custom development requires substantial investment but provides maximum control and differentiation. Projects of this scope typically span 12-24 months.
Regulatory Licensing Costs
Operating legally requires gambling licenses from relevant jurisdictions. License costs vary dramatically based on market, license type, and regulatory complexity.
Jurisdiction | Application Fee | Annual Fee | Timeline |
Malta (MGA) | €25,000 | €25,000+ | 3-6 months |
UK (UKGC) | £15,000-£75,000 | Revenue-based | 4-6 months |
Gibraltar | £10,000 | Revenue-based | 3-6 months |
Isle of Man | £5,000 | £35,000+ | 3-4 months |
Curacao | $10,000-$25,000 | $5,000-$15,000 | 2-4 weeks |
US State (varies) | $50,000-$500,000 | Varies widely | 6-18 months |
Beyond application fees, budget for legal counsel specializing in gambling licensing ($20,000-$100,000 depending on jurisdiction complexity), compliance consulting, and the personnel requirements many licenses mandate.
Integration Development Costs
Even turnkey platforms require integration work connecting the platform to essential services. Understanding these costs prevents budget shortfalls during the critical launch phase.
Payment Provider Integration: $5,000 - $30,000 per provider. Most operators require 5-10 payment methods, accumulating significant integration costs. Some platforms include popular payment methods; others charge separately.
KYC/AML Provider Integration: $10,000 - $50,000. Identity verification and anti-money laundering systems require sophisticated integration. Providers like Jumio, Onfido, or GBG charge both integration and per-verification fees.
Sports Data Feed Integration: $15,000 - $75,000. Connecting to odds providers and data feeds requires technical integration work. Complexity increases with the number of sports and markets covered.
CRM/Marketing Tool Integration: $5,000 - $25,000. Connecting player data to marketing automation, email systems, and analytics platforms enables effective player lifecycle management.
Recurring Operational Costs
Monthly and annual operational costs form the baseline expenses for running the sportsbook. These costs persist regardless of betting volume, making them critical for break-even analysis.
Platform Licensing Models
Providers structure ongoing licensing through various models, each with distinct implications for operators at different scales. Choosing the right iGaming platform solution requires understanding how these costs compound over time.
Revenue Share Model: 5-15% of Gross Gaming Revenue. Common among turnkey providers, revenue share aligns provider and operator interests. However, at scale, a 10% revenue share on $10 million monthly GGR equals $1 million monthly—potentially exceeding fixed-fee alternatives significantly.
Fixed Monthly License: $10,000 - $100,000 monthly. Predictable costs benefit financial planning but create risk during slow periods. Premium platforms with advanced features command higher fees.
Hybrid Structures: Base fee plus reduced revenue share. For example, $25,000 monthly plus 3% GGR balances predictability with volume-based scaling. These structures often optimize for mid-scale operators.
Sports Data and Odds Feed Costs
Sports data represents a significant ongoing expense, with costs varying based on coverage breadth and market depth.
Pre-Match Odds Feeds: $3,000 - $15,000 monthly for comprehensive coverage. Basic packages covering major sports cost less; full global coverage across 80+ sports approaches higher ranges.
Live/In-Play Odds: $10,000 - $50,000 monthly. Real-time data for live betting commands premium pricing. Coverage depth and latency requirements influence costs significantly.
Streaming Rights: $5,000 - $100,000+ monthly. Live streaming enhances player engagement but requires rights acquisition. Costs vary dramatically by sport and geographic rights.
Hosting and Infrastructure
Infrastructure costs scale with traffic and transaction volume. Cloud-based solutions offer flexibility but require careful cost management.
Cloud Hosting: $2,000 - $20,000 monthly depending on traffic. AWS, GCP, or Azure costs scale with usage. Peak events can spike costs significantly without proper architecture.
CDN and Performance: $500 - $5,000 monthly. Content delivery networks ensure fast global performance. Video streaming substantially increases bandwidth costs.
Security Services: $1,000 - $10,000 monthly. DDoS protection, WAF, and security monitoring represent essential ongoing expenses for any public-facing gambling operation.
Compliance and Regulatory Costs
Regulated markets impose ongoing compliance obligations with associated costs that operators must factor into operational budgets.
Annual License Renewal: $5,000 - $100,000+ depending on jurisdiction. Some jurisdictions charge flat renewal fees; others assess based on revenue.
Compliance Monitoring: $3,000 - $15,000 monthly. Third-party compliance monitoring, reporting tools, and audit preparation consume ongoing resources.
Responsible Gambling Tools: $1,000 - $5,000 monthly. Dedicated responsible gambling systems with player protection features increasingly required by regulators.
Variable Costs (Transaction-Based)
Variable costs scale directly with business volume. While healthy volume means these costs increase, the relationship reflects business success rather than inefficiency.
Payment Processing Fees
Every deposit and withdrawal incurs transaction costs that significantly impact margins, particularly for lower-value transactions.
Credit/Debit Cards: 2.5% - 4.5% per transaction. Gambling merchant category codes (MCCs) attract higher processing rates than standard retail. Chargebacks add additional costs.
E-Wallets: 1% - 3% per transaction. PayPal, Skrill, Neteller, and similar services offer lower rates than cards but charge setup and monthly fees.
Bank Transfers: $0.50 - $5.00 flat per transaction. Lower percentage costs benefit high-value transactions but fixed fees impact smaller deposits.
Cryptocurrency: 0.5% - 2% per transaction. Lower processing fees attract operators, though volatility and conversion costs require consideration.
KYC/Verification Costs
Player verification represents a per-player cost that accumulates with customer acquisition success.
Basic Document Verification: $1 - $3 per verification. Automated document checking provides cost-effective verification for standard cases.
Enhanced Verification: $5 - $15 per verification. Biometric verification, liveness detection, and enhanced due diligence for high-risk players increase costs.
Ongoing Monitoring: $0.10 - $0.50 per player monthly. Continuous PEP (Politically Exposed Persons) and sanctions screening for active players.
Gaming Taxes and Duties
Tax obligations vary dramatically by jurisdiction and represent unavoidable costs that directly impact profitability.
Jurisdiction | Tax Rate | Tax Base |
UK | 21% | Gross profits |
Germany | 5.3% | Stakes |
France | 33.3%+ | GGR |
Spain | 20% | GGR |
US States | 15-51% | Varies by state |
Malta | 5% | GGR (capped) |
Hidden Costs That Surprise Operators
Beyond documented fees, several cost categories frequently surprise operators who failed to anticipate them during planning phases.
Opportunity Cost of Delayed Launches
Extended integration timelines carry significant opportunity costs often overlooked in vendor evaluation. Enterprise platforms requiring 6-12 months for deployment versus modern providers achieving 2-4 week launches represent 5-11 months of lost revenue.
For an operation projecting $500,000 monthly revenue, a six-month delay represents $3 million in foregone revenue—likely exceeding any savings from selecting a "cheaper" but slower provider. This calculation alone justifies premium pricing for rapid deployment capability.
Integration Overruns
Initial integration estimates frequently prove optimistic. Third-party systems behave unexpectedly, documentation proves incomplete, or requirements evolve during development. Budget 20-40% contingency for integration work to avoid mid-project funding crises.
Customization Creep
"Minor" customizations accumulate surprisingly quickly. Each seemingly small request—adjusted bet slip layout, modified bonus rules, custom reporting format—requires development, testing, and documentation. Establish clear customization budgets and prioritization processes from the outset.
Staff Training and Onboarding
New platform adoption requires team training across operations, customer service, compliance, and marketing functions. Budget $5,000-$25,000 for comprehensive training programs depending on team size and platform complexity.
Chargeback and Fraud Losses
Gambling operations face elevated fraud and chargeback rates. Budget 1-3% of deposits for fraud-related losses initially, with reduction targets as fraud systems mature. Excessive chargebacks also risk payment processor relationship termination.
Currency Conversion Costs
Multi-currency operations face conversion costs that erode margins. Payment processors and banks charge 1-3% on currency conversions, compounding for operations spanning multiple currency zones.
Cost Optimization Strategies
Strategic decisions during vendor selection and operation design significantly impact long-term costs.
Negotiate Volume-Based Pricing
Most providers offer tiered pricing that improves with volume. Negotiate explicit tiers and thresholds upfront, with automatic rate improvements as volume milestones are achieved. Avoid contracts locking current rates regardless of growth.
Prioritize Time-to-Market
Given the substantial opportunity cost of delayed launches, prioritizing providers with proven rapid deployment—like MicroBee's 2-4 week capability—often delivers better ROI than marginally cheaper but slower alternatives.
Consolidate Vendor Relationships
Working with providers offering integrated solutions reduces the complexity and cost of managing multiple vendors. Consolidated platforms simplify compliance, reduce integration expenses, and provide single-point accountability.
Plan for Scale
Architecture decisions made during launch phase determine scaling costs. Cloud-native platforms scale efficiently; legacy architectures require expensive upgrades. Invest in scalable infrastructure initially to avoid costly migrations later.
Building Your Budget: A Practical Framework
Based on comprehensive industry analysis, operators can estimate total investment requirements using the following framework:
Operation Scale | First Year Investment | Monthly Operations |
Startup (Turnkey) | $100,000 - $250,000 | $15,000 - $40,000 |
Growth (White-label) | $250,000 - $750,000 | $40,000 - $100,000 |
Enterprise (Custom) | $750,000 - $3,000,000+ | $100,000 - $300,000+ |
These ranges provide planning guidance; specific requirements may fall outside these parameters based on unique circumstances. Contact potential providers for detailed quotes aligned with your specific requirements.
Conclusion
Understanding sports betting platform costs requires looking beyond headline figures to comprehensive total cost of ownership analysis. Initial setup costs, recurring operational expenses, volume-based variable costs, and hidden expenses all contribute to the true investment required.
The good news: the market offers options across the investment spectrum. Providers like MicroBee demonstrate that enterprise-quality platforms need not require enterprise budgets, particularly when time-to-market value is properly considered. Meanwhile, operators requiring maximum customization and control can invest in premium solutions aligned with those requirements.
Successful operators approach platform investment strategically—balancing upfront costs against long-term value, considering opportunity costs alongside direct expenses, and building financial models that account for realistic growth scenarios.
Ready to explore cost-effective platform options? Contact MicroBee for transparent pricing and discover how competitive rates combined with rapid deployment can optimize your sports betting platform investment.